Why Grid EAs Blow Up
Grid EAs look mechanical and low-drama until they are not. The ladder fills, closes, and refills, and equity climbs in small steps for weeks — then one pattern shows up and the account gives back most of that climb in days. This guide assumes you already run a grid, or are about to, and wants the failure patterns and the stop for each — for the concept and spacing math first, see the grid trading strategy guide. Most retail forex traders lose money, and a grid only changes the shape of the loss — nothing below is a signal or a guarantee, only mechanical failures matched with rule-based stops.
Quick Answer: Grid EAs blow up through repeatable patterns, not bad luck — a one-sided trend against a non-hedged ladder, an escalating lot multiplier, spacing that ignores the pair’s volatility, no hard position cap, gap and spread costs around news, swap drag on long-held baskets, and backtest settings tuned to one window. Each has a rule-based stop: a market-condition filter, a fixed lot size, an ADR-derived spacing formula, a software-enforced cap, an event-window rule, a holding-time limit, or a walk-forward test. None of these make a grid profitable — they only remove one way to fail.
1. A Trend Meets a Non-Hedged Grid
On the account: floating loss on one side grows steadily while the other sits idle — no new fills, no closes. The equity climb becomes a long, uninterrupted slide.
The mechanism. A grid profits from oscillation and has no built-in opinion about direction. In a sustained one-way move, every level on the losing side fills and stays open, because price never retraces far enough to hit the take-profit one spacing away. With n levels filled, floating loss grows with roughly the square of the count, while the winning side only pays one spacing per closed round trip — worked through here.
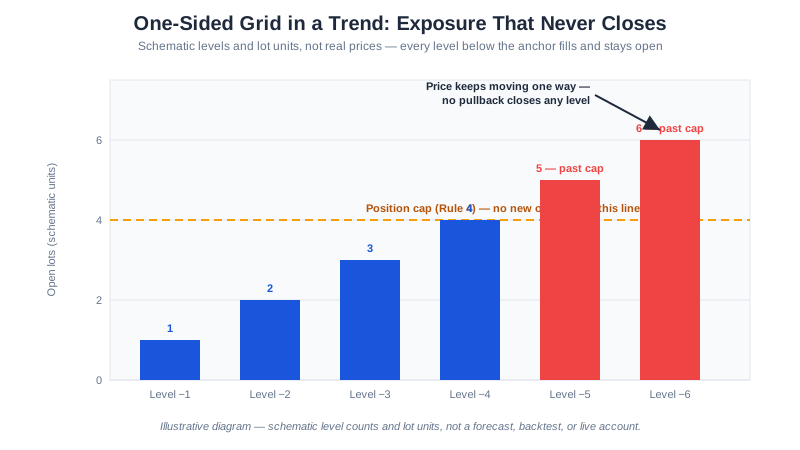
The rule that stops it. A market-condition filter running before any order is placed: trend strength (ADX is conventional) below a threshold, and recent closes inside a band no wider than a multiple of the average daily range. Fail either and the response is no new orders — not a wider grid.
2. Lot Multiplier or Martingale Sizing Bolted On
On the account: the equity curve looks better than a plain grid’s for months, until one basket fails to recover — and the loss is far larger than the level count suggests.
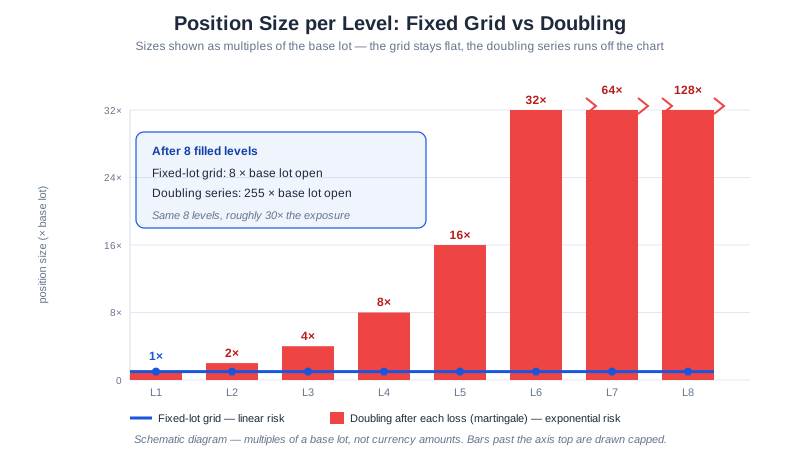
The mechanism. A grid martingale hybrid increases lot size at each level instead of holding it fixed, pulling the average entry closer to price so a smaller retracement closes the whole stack — which is what makes it look safer while it works. The risk curve, though, is now geometric: a schematic 1.5× multiplier from 0.01 reaches roughly 0.17 lots by level 8, and the margin those levels require typically arrives before the strategy’s own logic can close the basket. See grid trading vs martingale for the arithmetic and a parameter-sheet test for spotting escalation.
The rule that stops it. Fixed lot size at every level — multiplier exactly 1.0, no exceptions. An input named lot multiplier, lot factor, lot exponent, recovery mode, or averaging means escalation.
3. Grid Step Too Small for the Pair’s Volatility
On the account: constant trading, many small wins, and still a flat or losing month, because spread costs and a handful of one-way sessions eat the gains.
The mechanism. Spacing that is a small fraction of the pair’s typical daily movement fills every level almost immediately in any real move, and each round trip’s target sits closer to the typical spread, so more of every win is consumed by cost. The blueprint’s spacing formula — spacing = ADR(20) / N, floored at a multiple of the typical spread — keeps both in check; spacing differs by pair, ranked in best pairs for grid trading.
The rule that stops it. Derive spacing from measured volatility, never a pip number copied from another pair: spacing = ADR(20) / N, floored at K × the pair’s typical spread, recomputed on a schedule. The calculator below applies that formula to a reading you enter.
Grid-spacing calculator
Enter an ATR value and multiplier above to calculate spacing.
Educational tool, not investment advice. Spacing and level counts here follow the rule-based grid blueprint; verify against your own broker's spread, margin requirements, and lot step before running a live grid.
4. No Maximum-Orders or Max-Exposure Cap
On the account: margin usage climbs all session with no visible ceiling; the first anyone notices is a margin call, not a decision.
The mechanism. Without an explicit position cap, a grid keeps opening new levels as long as the market moves and margin allows, so the account’s maximum loss is not a chosen number — it is whatever the trend and the broker’s margin requirement produce. Pattern 1’s diagram shows this: the bars past the cap line are the same fill with nothing telling it to stop.
The rule that stops it. A hard, software-enforced cap on open positions per side (L), independent of remaining margin — no new orders at the cap, ever — paired with a total-exposure cap, since correlated grids on related pairs otherwise defeat a per-symbol cap. See the hard risk limits table, applied in the GridMaster setup guide.
5. News and Gap Events Widen the Cost of Every Fill
On the account: a single overnight or weekend session produces a loss disproportionate to the levels filled, at prices worse than the ladder’s own spacing predicts.
The mechanism. Two effects compound around scheduled events and weekend gaps. Brokers widen spreads into major releases, so every fill and take-profit costs more relative to spacing than usual. A genuine price gap also skips the levels in between rather than filling them, so any take-profit inside the gap is missed. Both recur at the same calendar points every time — not bad luck.
The rule that stops it. An event window blocking new orders ahead of tier-one releases, and a gap-protection weekend rule that flattens or reduces a deep stack before the close — decided before the event, not judged once the calendar is open.
6. Swap and Rollover Cost on Long-Held Baskets
On the account: a basket open for weeks shows a floating loss slightly larger than the price move alone explains, growing a little even on quiet nights.
The mechanism. Holding a position past the daily rollover point applies a swap charge or credit driven by the interest-rate differential between the two currencies, every night it stays open; one weekday’s rollover commonly charges a multiple of the normal rate to cover the weekend. A basket stuck in a trend never reaches its take-profit, so this cost stacks nightly on the floating loss for as long as it stays open.
The rule that stops it. Treat holding time as its own limit: a maximum nights-open count for a losing level, plus a weekend-close rule for any deep stack. Check your broker’s own contract specification for the rate; the mechanism is generic, the number is not.
7. Over-Optimised Backtest Settings (Curve Fitting)
On the account: the backtest that sold you on the configuration showed a smooth, almost uninterrupted equity curve. The live account, running the same settings, looks nothing like it within a few months.
The mechanism. A grid’s equity curve looks smooth right up until the move that ends it, which makes a short backtest window easy to curve-fit — spacing, level count, and thresholds tuned until they avoid every trend in that one window, without reflecting anything durable about the future. How to backtest a forex EA covers running the test; curve fitting survives an otherwise well-run one.
The rule that stops it. Walk-forward testing: optimise on one historical window, then test that exact parameter set — unchanged — on the following window it never saw, repeating forward through the history rather than tuning once against the whole dataset. A configuration that only performs on the window it was tuned against is showing curve fitting, not an edge — as published by Wikipedia’s walk-forward optimization overview (last edited 12 August 2026), the standard way to validate robustness on unseen data.
Pre-Flight Checklist: The Seven Rules in One Table
Run this before funding a grid EA beyond demo balance. Every row is a condition, not a number to copy — derive your own from your account size and the pair’s volatility, per the rule-based grid blueprint.
| # | Failure pattern | Rule that stops it |
|---|---|---|
| 1 | Trend vs. non-hedged grid | Market-condition filter (trend strength + range containment) blocks new orders |
| 2 | Lot multiplier / martingale sizing | Fixed lot every level — multiplier exactly 1.0 |
| 3 | Spacing too small for volatility | spacing = ADR(20) / N, floored at K × typical spread, recomputed on a schedule |
| 4 | No position or exposure cap | Hard software cap on positions per side and total exposure |
| 5 | News gaps and spread widening | Event window blocks orders before tier-one releases; weekend rule reduces deep stacks |
| 6 | Swap drag on long-held baskets | Holding-time limit and weekend close |
| 7 | Over-optimised backtest settings | Walk-forward testing on data never used to tune |
Where SteadyPips EAs Stand
Our own GridMaster EA is built around several rules above by default — fixed lot sizes, a hard cap on open positions, a drawdown limit, an equity stop, and a weekend close — but the market-condition filter and your sizing stay yours to set, per the rule-based grid blueprint. We publish no measured backtest table for a grid configuration — pattern 7’s reason, exactly. GridMaster does not yet have a published backtest table; the performance page lists which SteadyPips EAs do, each labeled as a backtest with its limits, and none of those figures are quoted here.
Test Before You Fund It
Every rule above is something a demo account can check first: run the filter, the spacing formula, and the caps through one real trending period before trusting them with live capital. Running a grid EA at all needs a broker permitting hedging, automated trading, and micro lots; XM meets those three requirements on MT4 and MT5.
Trading foreign exchange carries a high level of risk and may not be suitable for all investors. Past performance is not indicative of future results. Grid trading strategies, including EAs built around them, can produce significant drawdowns during trending markets. Always test on a demo account before trading live.
![Best Forex Pairs for Grid Trading: 7 Pairs Ranked [2026]](/images/charts/best-forex-pairs-for-grid-trading-ranging-vs-trending.svg)
![Forex Grid Trading Strategy: Complete Guide + Free EA [2026]](/images/charts/grid-trading-pattern.png)