Moving Average Trading Strategies
Moving averages are among the most widely used indicators in forex trading, smoothing price action to help identify trend direction and entry points. What they cannot do — and what most introductions to the topic skip — is tell you the future. Understanding what an MA actually is mechanically explains both why crossover systems work at all and why they lose most of their individual trades.
This guide assumes the basics from our forex trading for beginners roadmap and goes one level deeper into a single indicator family.
What a Moving Average Actually Is
A moving average is a lagging, low-pass filter. It averages recent prices, which by construction means it responds to a trend only after that trend has already been under way for some of the averaging period. A crossover — the fast average moving above or below the slow one — is a description of the recent past crossing a threshold, not a prediction. This is not a flaw to be engineered around; it is the entire mechanism. Any strategy built on moving averages inherits this lag, and every design choice in this guide is really a choice about how much lag to accept in exchange for how much noise to filter out.
Simple Moving Average (SMA) weights every price in the window equally, reacts slowest, and is more common for identifying long-term trend direction. Exponential Moving Average (EMA) weights recent prices more heavily, reacts faster, and is what our SteadyPips EA uses for its 12/26/200 setup.
| SMA | EMA | |
|---|---|---|
| Weighting of prices in the window | Equal weight to every bar | Recent bars weighted more heavily |
| Reaction speed to a new trend | Slower — lags further behind the current price | Faster — turns sooner, at the cost of more false turns |
| Typical use in this guide | Long-term direction filter (e.g. 200 SMA/EMA) | Faster crossover signals (e.g. 12/26 EMA) |
| Sensitivity to a single noisy bar | Lower — one outlier bar barely moves it | Higher — one outlier bar moves it more |
Golden Cross / Death Cross: a shorter MA crossing above a longer one is read as bullish (golden cross); crossing below is read as bearish (death cross). Common combinations: 50/200 SMA for long-term positioning, 12/26 EMA for medium-term signals (SteadyPips), 5/20 EMA for short-term entries.
The Whipsaw Problem, Quantified
A crossover system’s central weakness is that it cannot distinguish a trend from a range — it reacts identically to both, which means it produces its worst results in exactly the market condition it can’t detect. In a trend, one crossover captures the whole move. In a range, price crosses back and forth across both averages repeatedly, and each crossing generates a trade with no follow-through to pay for it.
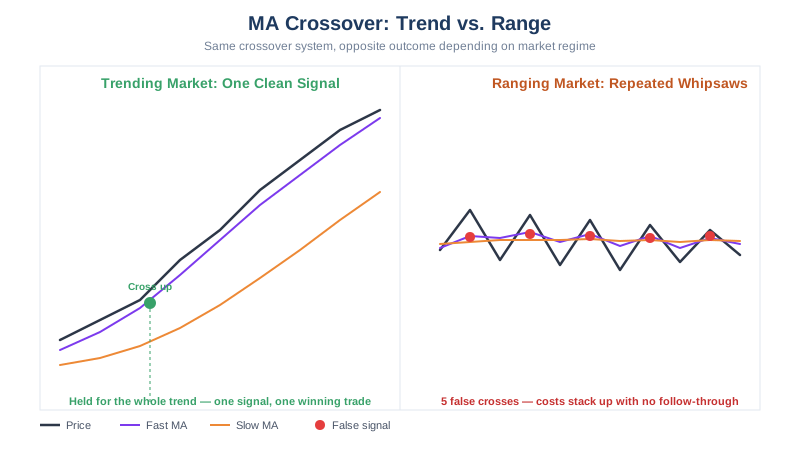
This is also why a sub-50% win rate is the normal shape of a trend-following system, not evidence something is wrong. Our own DualHorizon EA — an EMA-cross strategy filtered by the H4 trend — currently backtests at a 34.1% win rate on EUR/USD with a profit factor of 1.41, the only pair among the three it was tested on that clears our recommendation threshold (see the current, corrected figures on our performance page). Roughly two losing trades for every winner, and the system still clears the bar, because the winners run further than the losers cost. A crossover strategy that instead shows an unusually high win rate on paper is the one to look at sceptically — it usually means the take-profit is set so close that wins are frequent and small while a single bad loss can erase many of them.
Case Study: The Dual EMA Crossover, Bar by Bar
This is the core logic behind SteadyPips: fast EMA (12), slow EMA (26), trend filter (200 EMA). Buy when the 12 EMA crosses above the 26 EMA and price is above the 200 EMA; sell on the mirrored condition below it. Stop loss at 1.5x ATR, take profit at 2.0x ATR. Walking through it schematically, bar by bar, shows exactly where the lag from the “What a Moving Average Actually Is” section shows up in a live decision — the levels below are relative markers, not real prices, for exactly that reason.
| Bar | Price action (schematic) | 12 EMA vs 26 EMA | Position status |
|---|---|---|---|
| 1–4 | Drifting sideways, closes bouncing around the 200 EMA | 12 EMA and 26 EMA tangled, no clear order | Flat — no signal |
| 5 | A strong bar closes at roughly +1 ADR above bar 4, clears the 200 EMA | 12 EMA crosses above 26 EMA | Entry: long, on the close of bar 5 |
| 6–8 | Trend continues, each bar’s low stays above the rising 26 EMA | 12 EMA pulls further above 26 EMA | Held — stop trails at 1.5x ATR below the recent swing low |
| 9 | A sharp reversal bar closes roughly −2x ATR from the bar 8 close | 12 EMA still above 26 EMA, gap narrowing | Stop-loss hit intrabar — position closed for a loss |
| 10–13 | Price chops sideways for several bars around the 26 EMA | 12 EMA crosses below then back above 26 EMA twice | Flat, then a false re-entry on the first re-cross, stopped again |
Two things this walkthrough makes concrete. First, the entry on bar 5 only exists because bars 1–4 already happened — a crossover signal is definitionally late, confirming a move that is already several bars old. Second, bars 10–13 are the whipsaw failure mode from the section above, shown as a sequence rather than described abstractly: two crosses, two small losses, no trend to pay for either.
What the 200 EMA filter actually does, mechanically: in this walkthrough it is what kept the system flat through bars 1–4 rather than trading the tangle — it restricts entries to trades aligned with the longer-term trend and removes some counter-trend crossover signals. An earlier version of this page claimed this filter “significantly improves the win rate” — we have not measured that in isolation, by running the same 12/26 crossover with and without the 200 EMA filter and comparing results, and we are not going to repeat an unsupported claim just because it sounds intuitive. Until that comparison exists, treat the filter’s contribution to win rate, profit factor, or drawdown as untested, not established.
Two Other Moving Average Variants, Briefly
Pullback to the MA
Setup: a single MA (20 or 50 EMA) on H4 or Daily. In an established uptrend, wait for a pullback to the MA and enter long on a bullish rejection candle; stop below the MA, target the prior swing high or a 2:1 reward. Unlike the crossover case study above, entry timing here depends on a candlestick judgment call at the MA, not a mechanical cross — which is exactly the trade-off in the failure-mode table below.
MA as a Trailing Filter
Setup: fast (5 EMA), medium (21 EMA), slow (55 EMA), all three required to align in trend direction before entry, with the fast/medium cross also used to trail the exit once in a position.
Failure Modes by Variant
| Variant | What it’s good at | How it specifically fails |
|---|---|---|
| Crossover (Strategy 1) | Capturing a trend once it’s established | Whipsaws repeatedly in a range — no mechanism to detect one |
| Pullback-to-MA (Strategy 2) | Better entry price within a confirmed trend | The pullback can be the trend actually reversing, not pausing — no built-in way to tell the two apart until after entry |
| MA-as-trailing-filter (Strategy 3) | Locking in profit as a trend extends | Trails too tightly in a choppy trend, exiting winners early on noise that never threatened the trend |
Choosing Periods Without Curve-Fitting
Test a range of plausible period combinations and look at the shape of the results, not just the best single result. A robust setting sits on a plateau — many nearby combinations (11/25, 12/26, 13/27) perform similarly — which suggests whatever edge exists comes from market behaviour, not from fitting one specific historical stretch. A single sharp peak surrounded by mediocre or losing results on either side is the signature of curve-fitting: it found noise in that dataset, not a real pattern. Our backtesting guide covers the out-of-sample testing that catches this before it costs real money.
Automating a Moving Average Strategy
Our SteadyPips EA implements the Dual EMA Crossover strategy described above, with an ATR volatility filter, dynamic stop loss and take profit, and a trailing stop. Its published figures, where they exist, are on our performance page — hypothetical backtest results, not a projection of what any account will do.
Running a crossover EA on an FCA/ESMA/ASIC-capped account. The ATR-based stop and target in a strategy like this scale the trade’s risk in price terms, but the lot size available for a given dollar risk still depends on the leverage your account carries. ESMA caps retail leverage on major FX pairs at 30:1 for EU-regulated accounts (Board of Supervisors decision, 23 March 2018, effective 1 August 2018, as published by ESMA), the FCA applies and has confirmed the same structure permanently for UK retail clients, and ASIC applies the same 30:1 cap for Australian retail clients from 29 March 2021, as published by ASIC. A crossover EA backtested against an assumed higher offshore leverage will size positions differently once it’s live on a capped account at the same deposit — check the EA’s money-management settings against your actual account’s leverage, not the figure used when the strategy was tuned, before it trades live.
Frequently Asked Questions
Is a low win rate a sign that a moving average strategy is broken?
Not by itself. Trend-following systems typically win less than half their trades and rely on a small number of large winners to outrun a larger number of small losses. Our own DualHorizon EA’s current backtest — EURUSD, profit factor 1.41, win rate 34.1% — clears our recommendation threshold with a win rate under 35%. The profit factor, not the win rate, is what determines whether a system works.
Does the 200 EMA trend filter actually improve win rate?
We don’t know, and we’re not going to claim otherwise. Earlier versions of this page asserted it significantly improves win rate; we have never isolated the filter’s contribution by testing the same entry logic with and without it, so that claim was unsupported and we’ve removed it. What we can say mechanically: it restricts entries to the direction of the longer-term trend and removes some counter-trend signals. Whether that raises the win rate, the profit factor, both, or neither, is untested.
What is the biggest risk of a moving average crossover system?
Whipsaw in a ranging market. A crossover strategy has no concept of whether the market is trending or ranging — it reacts to whatever the two averages do. In a range, price crosses back and forth across both averages repeatedly, generating a string of small losing trades with no trend to pay for them. This is the normal failure mode of the entire strategy family, not a bug in any one implementation.
How should I choose moving average periods without curve-fitting?
Test a plausible range of period combinations and look for a broad plateau of similar results, not a single sharp peak. A plateau means many nearby settings perform similarly, which suggests the edge (if any) comes from the underlying market behaviour rather than from tuning to one specific historical stretch. A lone spike surrounded by poor results on either side is the signature of curve-fitting, not of a robust setting.
Continue Your Research
- Forex Trading for Beginners — the roadmap this indicator guide builds on
- SteadyPips EA: Dual EMA Crossover Automated — an EA built on the 12/26/200 setup described above
- DualHorizon EA — current backtest figures for a moving-average system
- Backtesting Guide for Forex EAs — testing a crossover rule before trading it live
This article is for educational purposes only and does not constitute financial advice. Past performance is not indicative of future results.