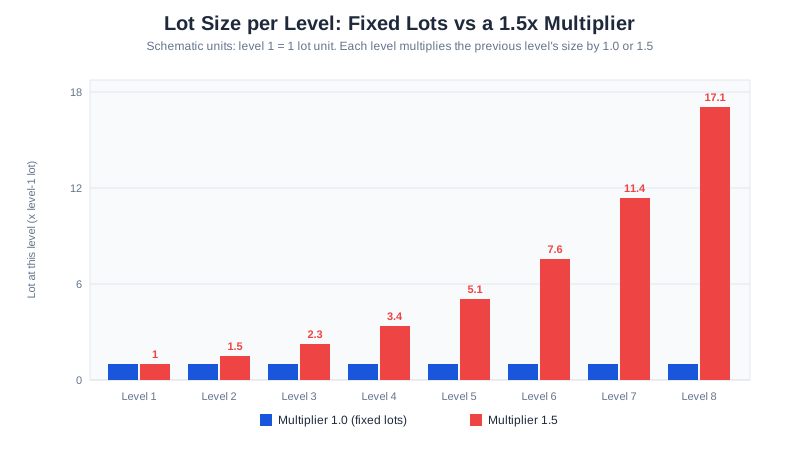
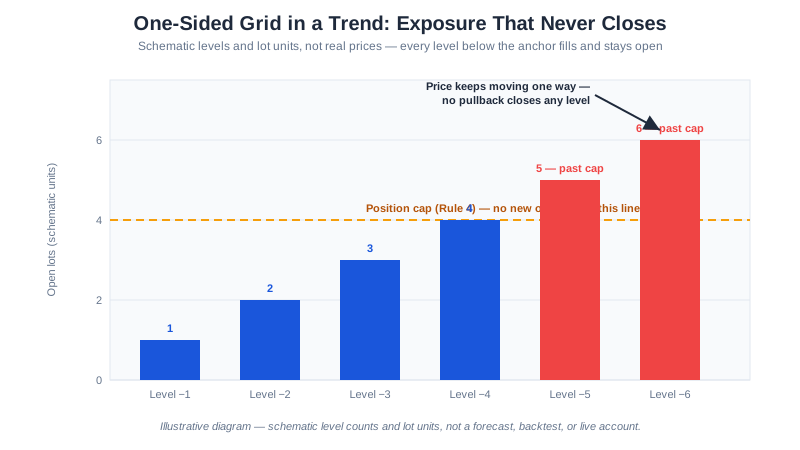
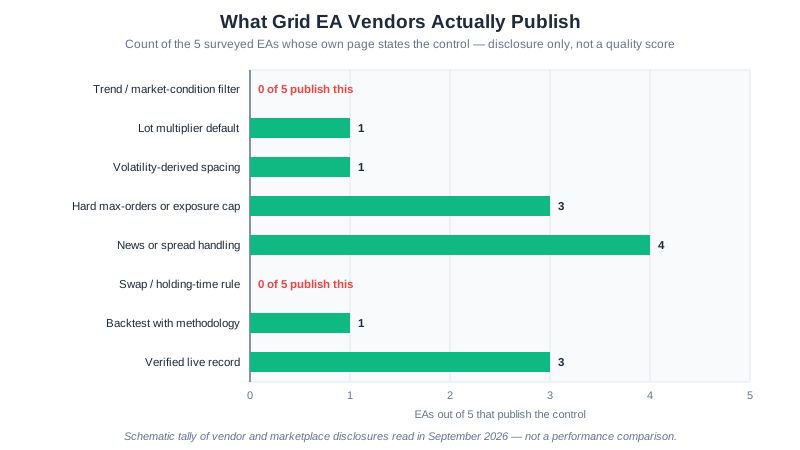
Quick Answer: A grid EA backtest is trustworthy only if it reports floating drawdown (not just closed profit), uses real-tick or finely modelled data, survives a re-run at a higher spread, and holds up on out-of-sample windows judged by rules written before the run. The usual trap is a smooth closed-equity curve that hides a deep open stack. Most retail traders lose money, and a passing backtest does not change that.
Why Grids Flatter a Backtest
We will start with an admission: we have not published a grid EA backtest. Our performance page has hypothetical tables for SnapBack, QuickPulse and DualHorizon, and states that GridMaster has no published figures yet. This guide is the method we are building before we publish one, and the one we would apply to a vendor’s report.
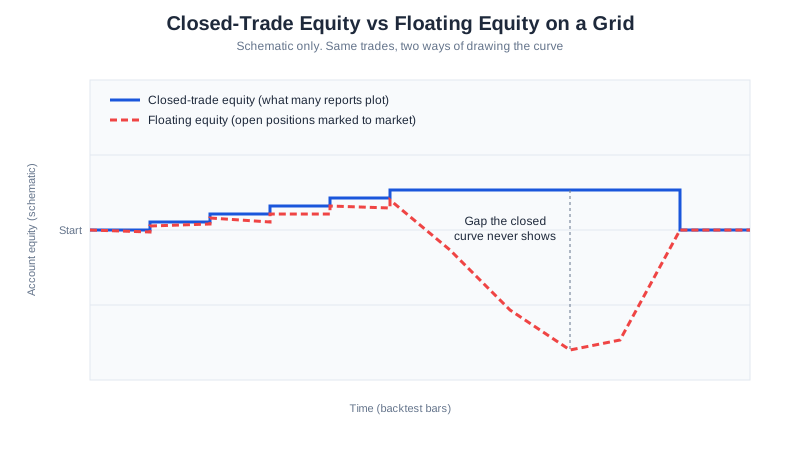
A grid wins often and loses rarely, and the losses are deferred. Each level closes for roughly one step, so the win rate looks excellent, while an adverse trend leaves a stack open and unrealised. That produces four distortions:
- Many small wins hide a tail. One stack that never recovers can erase a long run of tiny wins. The seven failure patterns are all tail events.
- Closed equity is not account equity. A report that plots balance only moves when a level closes. The account you would hold moves every tick.
- Fills inside a bar are guesses. A 10-pip grid on hourly bars can cross several levels in one bar, and which were hit first depends on whether the high or the low came first.
- Costs scale with activity. A grid trades a lot, so a small per-trade cost assumption is multiplied many times.
The Data Problem We Hit Ourselves
On July 30, 2026 we corrected our own engine. It read each Dukascopy hourly bar’s high and low in the wrong order, on every bar, which corrupted stop and take-profit touch detection plus ATR and ADX. We re-ran every published test with no parameter changes, and the corrected results were worse: QuickPulse stopped passing on any pair. The post-mortem has the detail.
For a grid this class of bug is worse, because fills are decided by the high and low. The check is cheap: assert low <= open <= high and low <= close <= high on every bar before the data reaches the tester.
The second hazard is completeness. When a download fails, a missing month can be stored as zero bars and look like a quiet market, which silently shortens or flatters a test. We have seen a data feed answer with errors under load, so our data scripts retry each month and refuse to treat a failed month as empty. Before believing a result, count the months and bars in the window and compare them with the calendar.
For the tester itself, MetaQuotes lists several tick modelling modes, and they differ a lot. As published by MetaQuotes (MetaTrader 5 Help, retrieved November 4, 2026), “Every tick based on real ticks” uses real ticks accumulated by brokers, “1 minute OHLC” emulates only four prices per minute bar, and “Open prices only” uses just the open price. As published by MetaQuotes in the MQL5 article “Testing trading strategies on real ticks” (August 4, 2016), if real ticks are missing for some intervals the tester simulates the price as in the “Every tick” mode. So even a real-ticks run can contain simulated stretches; ask what share of the history was real. The wider backtesting guide covers the rest of the report.
Spread and Cost Assumptions
Our own harness models the broker spread as a fixed per-pair cost on each trade, on hourly bid candles. That is a simplification: a fixed spread cannot show widening around news or at rollover, which is when a deep stack fills. State your assumption and then break it.
Here is the stress test with clearly illustrative inputs. For the spacing we use the measured 250-session average daily range for EUR/USD, 61.5 pips (Dukascopy hourly bid candles, as of 2026-10-30, from our ADR table). With N = 6, step = 61.5 / 6, about 10.25 pips, and a take-profit equal to the step. The spreads below are made up for the exercise and are not quotes from any broker.
| Assumed spread (illustrative) | Net pips per winning level | Change vs 1.0 pip |
|---|---|---|
| 1.0 pip | 9.25 | baseline |
| 2.0 pips | 8.25 | -10.8% |
| 3.0 pips | 7.25 | -21.6% |
A tripled spread removes about a fifth of every win, while the stack that does not recover still has to be closed at the wider spread. A profit factor that was comfortably above a threshold at the low assumption can sit near it, or below it, at triple. That is why the rule is: re-run the identical test at two and three times your assumed spread and record where profit factor crosses your threshold.
Two more costs sit outside many reports. Swap accrues on every night a level stays open, and a stack stuck in a trend pays it for weeks (see the swap pattern in the failure list). Check that the tester charged it, and read the rate from your own broker’s contract specification. Commission applies per lot on raw-spread accounts, so add it to the round trip as described in what a round trip costs.
Walk-Forward: A Rule-Based Blueprint
Walk-forward means choosing settings on a window of history, freezing them, then testing once on the window that follows. In-sample is the window you may look at as often as you like. Out-of-sample is the window you run once. Then both windows roll forward and you repeat.
Blueprint. The lengths and thresholds are yours to choose; write them down before you run anything.
- Windows. For example 12 months in-sample and 3 months out-of-sample, rolled forward 3 months at a time. Make the out-of-sample window long enough to contain at least one trending stretch for your pair.
- Freeze. Step, level cap, lot and take-profit are fixed at the start of each out-of-sample window. Change one after seeing the result and that window becomes in-sample.
- Pass rule. Our published gate is profit factor above 1.3, maximum drawdown below 30% and more than 50 trades, which are our own thresholds and not an industry standard. For a grid we would add a limit on floating drawdown and on simultaneously open positions, and count completed cycles rather than only trades.
- Stop conditions. Stop the evaluation if any out-of-sample window breaches the floating-drawdown limit, if the stitched out-of-sample result fails the gate, or if the spread stress test turns the result negative.
- Failure modes. The in-sample result is good and the out-of-sample is flat (a curve-fitted step). Results hold in only one regime. The out-of-sample window had no trend, so the grid was never really tested.
We have not run this on a grid EA yet, and our performance page says plainly that a 26-month window carries no out-of-sample guarantee. A pass shows a rule survived the windows it saw; it does not show it will keep surviving. For step, cap and take-profit choices, see grid EA settings explained, and for spacing, the grid spacing calculator.
Checklist for a Vendor’s Backtest Report
| Ask | Good sign | Warning sign |
|---|---|---|
| Is floating drawdown reported? | Max floating drawdown and peak open positions shown | Only closed-trade profit or a balance curve |
| Tick modelling? | Real ticks, with the share of real history stated | Open prices only, or modelling quality unstated |
| Spread assumption? | Stated, with a re-run at a higher spread | Single low fixed value, never stressed |
| Swap and commission? | Included and stated | Zero or not mentioned |
| Data completeness? | Window, source and bar counts given | Gaps, or a short window with no explanation |
| Out-of-sample? | Walk-forward windows with frozen settings | One optimised run over the whole history |
| Worst trend covered? | Test includes a long one-way move | Only ranging periods |
| Equity curve realism? | Dips and slow recoveries visible | Near-straight line |
If a report passes, move to a demo account before any live capital. A broker account is needed to forward-test, but no EA of ours requires a particular broker, and XM is simply one optional choice. Backtests are hypothetical, and most retail traders lose money.