Quick Answer: We measured the mean range of every UTC hour across 28 forex pairs, using each pair’s last 250 qualifying sessions of Dukascopy hourly bid candles (roughly September 2025 to August 31, 2026). Twenty of the 28 pairs post their widest average hour at 14:00 UTC, inside the London/New York overlap; EUR/USD’s widest hour is 13:00 UTC at 18.7 pips against a quietest hour of 6.4 pips at 22:00 UTC, a 2.92x ratio. Across all 28 pairs that widest-to-quietest ratio runs from 1.90x on NZD/JPY to 3.45x on CAD/CHF. A wider hour is a bigger measured move, not a better one to trade.
| Pair | Widest hour (UTC) | Pips | Quietest hour (UTC) | Pips | Widest ÷ quietest |
|---|---|---|---|---|---|
| CAD/CHF | 21:00 | 11.4 | 03:00 | 3.3 | 3.45x |
| GBP/CAD | 14:00 | 30.7 | 04:00 | 9.1 | 3.37x |
| EUR/GBP | 14:00 | 10.0 | 03:00 | 3.0 | 3.33x |
| EUR/CAD | 14:00 | 23.2 | 03:00 | 7.1 | 3.27x |
| USD/CAD | 14:00 | 19.8 | 04:00 | 6.1 | 3.25x |
| EUR/CHF | 14:00 | 11.0 | 04:00 | 3.4 | 3.24x |
| GBP/CHF | 14:00 | 16.7 | 04:00 | 5.2 | 3.21x |
| NZD/CHF | 21:00 | 13.8 | 19:00 | 4.4 | 3.14x |
| GBP/USD | 14:00 | 25.3 | 23:00 | 8.2 | 3.09x |
| AUD/NZD | 21:00 | 20.0 | 19:00 | 6.5 | 3.08x |
| EUR/USD | 13:00 | 18.7 | 22:00 | 6.4 | 2.92x |
| USD/CHF | 14:00 | 16.2 | 23:00 | 5.6 | 2.89x |
| AUD/CHF | 21:00 | 12.8 | 23:00 | 5.1 | 2.51x |
| AUD/USD | 14:00 | 16.1 | 23:00 | 6.6 | 2.44x |
| USD/JPY | 13:00 | 27.0 | 21:00 | 11.7 | 2.31x |
| GBP/AUD | 14:00 | 34.9 | 23:00 | 15.2 | 2.30x |
| EUR/AUD | 14:00 | 29.7 | 23:00 | 13.3 | 2.23x |
| AUD/CAD | 14:00 | 16.8 | 23:00 | 7.7 | 2.18x |
| NZD/CAD | 21:00 | 16.9 | 04:00 | 7.8 | 2.17x |
| GBP/JPY | 14:00 | 37.3 | 23:00 | 17.5 | 2.13x |
| GBP/NZD | 14:00 | 38.3 | 19:00 | 18.2 | 2.10x |
| CHF/JPY | 14:00 | 33.3 | 19:00 | 16.0 | 2.08x |
| NZD/USD | 14:00 | 13.1 | 23:00 | 6.3 | 2.08x |
| AUD/JPY | 14:00 | 24.8 | 23:00 | 12.2 | 2.03x |
| EUR/JPY | 07:00 | 26.9 | 20:00 | 13.3 | 2.02x |
| EUR/NZD | 14:00 | 31.9 | 19:00 | 16.0 | 1.99x |
| CAD/JPY | 14:00 | 20.4 | 23:00 | 10.3 | 1.98x |
| NZD/JPY | 14:00 | 19.6 | 19:00 | 10.3 | 1.90x |
As of August 31, 2026. Source: Dukascopy hourly bid candles. Figures in pips, mean range of the pair's UTC hour over its last 250 qualifying sessions. The 21:00 and 22:00 UTC hours contain the daily 5 p.m. New York rollover, when spreads typically widen; on bid candles that widening registers as range. Past hourly ranges describe what has already happened and are not a forecast of the next session.
Show the full 24-hour grid for all 28 pairs
| Pair | 00 | 01 | 02 | 03 | 04 | 05 | 06 | 07 | 08 | 09 | 10 | 11 | 12 | 13 | 14 | 15 | 16 | 17 | 18 | 19 | 20 | 21 | 22 | 23 |
|---|---|---|---|---|---|---|---|---|---|---|---|---|---|---|---|---|---|---|---|---|---|---|---|---|
| CAD/CHF | 4.7 | 4.6 | 3.8 | 3.3 | 3.4 | 4.0 | 5.8 | 7.9 | 7.7 | 6.9 | 6.4 | 6.8 | 9.1 | 9.7 | 10.4 | 9.4 | 7.1 | 6.1 | 5.8 | 5.3 | 6.7 | 11.4 | 9.6 | 5.2 |
| GBP/CAD | 12.2 | 11.9 | 10.3 | 9.2 | 9.1 | 11.4 | 17.7 | 22.9 | 23.4 | 20.1 | 19.5 | 22.2 | 27.3 | 28.3 | 30.7 | 27.5 | 20.7 | 18.1 | 15.9 | 14.4 | 15.7 | 20.8 | 16.5 | 10.4 |
| EUR/GBP | 4.1 | 3.8 | 3.2 | 3.0 | 3.0 | 3.9 | 6.4 | 8.4 | 9.0 | 7.4 | 7.6 | 7.8 | 8.6 | 8.9 | 10.0 | 9.1 | 6.9 | 5.6 | 4.8 | 4.1 | 4.8 | 8.0 | 5.8 | 3.2 |
| EUR/CAD | 10.0 | 10.1 | 8.5 | 7.1 | 7.1 | 8.8 | 12.9 | 16.0 | 16.5 | 14.1 | 13.7 | 15.4 | 20.1 | 21.8 | 23.2 | 21.3 | 16.0 | 13.9 | 13.0 | 12.1 | 13.3 | 15.5 | 13.1 | 7.9 |
| USD/CAD | 8.8 | 9.1 | 8.0 | 6.6 | 6.1 | 6.9 | 9.6 | 11.7 | 11.2 | 9.9 | 9.4 | 11.5 | 16.1 | 18.4 | 19.8 | 18.4 | 14.3 | 11.8 | 11.3 | 10.6 | 10.6 | 10.2 | 7.7 | 6.4 |
| EUR/CHF | 5.0 | 4.8 | 4.1 | 3.7 | 3.4 | 4.2 | 6.5 | 9.2 | 9.4 | 8.7 | 7.4 | 7.4 | 8.4 | 9.6 | 11.0 | 9.5 | 7.0 | 5.7 | 5.0 | 4.6 | 5.3 | 9.0 | 6.6 | 3.9 |
| GBP/CHF | 7.4 | 6.8 | 5.9 | 5.5 | 5.2 | 6.6 | 10.1 | 13.6 | 14.8 | 13.3 | 12.2 | 12.2 | 14.1 | 15.4 | 16.7 | 14.8 | 11.3 | 9.0 | 8.0 | 7.2 | 8.7 | 14.5 | 12.2 | 6.1 |
| NZD/CHF | 6.4 | 6.8 | 6.0 | 5.2 | 4.6 | 4.8 | 5.8 | 7.0 | 7.2 | 6.5 | 5.6 | 5.8 | 6.8 | 7.8 | 8.6 | 8.3 | 5.6 | 4.9 | 4.9 | 4.4 | 5.9 | 13.8 | 10.4 | 5.4 |
| GBP/USD | 12.2 | 12.5 | 10.6 | 9.3 | 8.9 | 10.8 | 15.8 | 19.9 | 20.4 | 17.4 | 16.3 | 18.4 | 22.6 | 24.4 | 25.3 | 24.6 | 18.0 | 16.0 | 14.9 | 12.6 | 11.2 | 11.0 | 9.7 | 8.2 |
| AUD/NZD | 13.3 | 14.3 | 11.5 | 11.2 | 9.5 | 9.4 | 10.3 | 11.1 | 10.8 | 9.4 | 8.2 | 8.8 | 10.1 | 11.4 | 12.3 | 11.9 | 7.9 | 6.8 | 6.7 | 6.5 | 7.9 | 20.0 | 13.7 | 9.2 |
| EUR/USD | 10.1 | 10.4 | 8.5 | 7.2 | 7.2 | 8.5 | 12.0 | 14.5 | 14.8 | 12.8 | 11.8 | 13.1 | 17.0 | 18.7 | 18.5 | 18.1 | 13.6 | 12.0 | 11.9 | 10.2 | 9.0 | 7.0 | 6.4 | 6.5 |
| USD/CHF | 8.4 | 8.4 | 6.7 | 5.9 | 5.8 | 6.8 | 9.7 | 12.5 | 12.5 | 11.0 | 10.1 | 10.8 | 14.3 | 15.3 | 16.2 | 15.1 | 11.2 | 9.6 | 9.4 | 8.2 | 7.5 | 9.8 | 7.3 | 5.6 |
| AUD/CHF | 8.1 | 8.3 | 7.0 | 6.3 | 5.9 | 6.4 | 7.2 | 8.7 | 8.8 | 8.2 | 7.0 | 7.1 | 8.1 | 9.9 | 11.3 | 10.7 | 7.3 | 6.3 | 6.0 | 5.3 | 6.6 | 12.8 | 9.4 | 5.1 |
| AUD/USD | 11.6 | 12.9 | 10.7 | 9.2 | 8.4 | 9.0 | 10.6 | 11.6 | 11.7 | 10.5 | 9.4 | 10.3 | 13.1 | 14.9 | 16.1 | 15.8 | 11.3 | 10.3 | 10.1 | 8.6 | 7.2 | 7.7 | 6.7 | 6.6 |
| USD/JPY | 25.0 | 21.4 | 16.6 | 15.3 | 16.6 | 16.1 | 20.9 | 23.4 | 22.7 | 19.3 | 16.3 | 16.8 | 22.7 | 27.0 | 24.8 | 23.9 | 18.3 | 16.8 | 16.5 | 15.2 | 13.3 | 11.7 | 12.1 | 14.4 |
| GBP/AUD | 24.7 | 26.2 | 22.0 | 19.6 | 18.5 | 19.2 | 23.2 | 26.9 | 27.0 | 23.8 | 22.0 | 22.8 | 25.5 | 29.5 | 34.9 | 32.8 | 22.8 | 20.0 | 17.6 | 15.6 | 17.5 | 23.9 | 20.0 | 15.2 |
| EUR/AUD | 22.9 | 24.3 | 20.3 | 18.1 | 16.7 | 17.5 | 19.7 | 22.1 | 22.1 | 19.8 | 17.8 | 17.9 | 20.8 | 25.7 | 29.7 | 28.5 | 19.6 | 16.7 | 16.0 | 14.0 | 15.4 | 19.3 | 15.3 | 13.3 |
| AUD/CAD | 12.8 | 14.1 | 11.5 | 10.0 | 9.2 | 9.8 | 11.4 | 12.3 | 12.6 | 11.4 | 10.2 | 11.3 | 14.6 | 16.4 | 16.8 | 16.0 | 11.4 | 10.5 | 10.0 | 9.0 | 9.7 | 13.1 | 11.2 | 7.7 |
| NZD/CAD | 10.9 | 12.0 | 10.2 | 8.8 | 7.8 | 8.0 | 10.1 | 11.0 | 11.2 | 9.7 | 9.0 | 10.1 | 12.9 | 14.0 | 13.9 | 13.3 | 9.4 | 8.8 | 8.8 | 7.9 | 8.7 | 16.9 | 13.0 | 7.9 |
| GBP/JPY | 28.4 | 24.3 | 19.4 | 18.8 | 20.1 | 20.5 | 27.5 | 33.8 | 33.5 | 28.2 | 25.1 | 26.0 | 30.2 | 34.0 | 37.3 | 34.2 | 24.8 | 22.0 | 19.5 | 17.9 | 17.6 | 21.1 | 19.1 | 17.5 |
| GBP/NZD | 28.1 | 30.6 | 26.8 | 23.5 | 20.4 | 20.7 | 26.4 | 31.1 | 31.5 | 27.5 | 25.4 | 26.6 | 30.2 | 33.5 | 38.3 | 35.8 | 24.5 | 21.8 | 20.1 | 18.2 | 18.8 | 34.7 | 25.8 | 21.3 |
| CHF/JPY | 25.5 | 22.6 | 17.8 | 17.7 | 18.4 | 18.6 | 24.3 | 31.5 | 30.7 | 26.1 | 23.5 | 23.0 | 27.3 | 30.6 | 33.3 | 30.8 | 21.5 | 19.1 | 17.3 | 16.0 | 16.2 | 24.2 | 22.5 | 17.2 |
| NZD/USD | 9.9 | 10.9 | 9.3 | 7.9 | 7.0 | 7.4 | 9.3 | 10.2 | 10.3 | 9.0 | 8.1 | 9.1 | 11.5 | 12.8 | 13.1 | 13.1 | 9.3 | 8.7 | 8.5 | 7.3 | 6.5 | 10.1 | 7.8 | 6.3 |
| AUD/JPY | 21.9 | 20.8 | 17.3 | 15.8 | 15.6 | 16.0 | 17.7 | 19.6 | 19.2 | 16.7 | 14.8 | 14.6 | 17.5 | 21.1 | 24.8 | 23.2 | 16.5 | 14.9 | 13.9 | 12.6 | 12.5 | 14.1 | 13.0 | 12.2 |
| EUR/JPY | 24.0 | 20.7 | 16.2 | 15.8 | 16.9 | 16.9 | 21.9 | 26.9 | 25.6 | 21.6 | 18.9 | 18.5 | 22.0 | 24.8 | 26.1 | 24.5 | 17.7 | 16.4 | 14.6 | 13.5 | 13.3 | 14.7 | 13.5 | 14.1 |
| EUR/NZD | 25.6 | 28.2 | 24.5 | 21.1 | 18.3 | 18.7 | 22.5 | 25.6 | 25.7 | 22.5 | 20.5 | 20.7 | 24.6 | 28.0 | 31.9 | 30.6 | 21.0 | 18.1 | 17.7 | 16.0 | 16.8 | 27.9 | 23.1 | 17.8 |
| CAD/JPY | 16.6 | 14.0 | 11.4 | 10.4 | 11.3 | 10.9 | 14.1 | 16.8 | 16.2 | 13.2 | 12.0 | 12.6 | 16.8 | 19.4 | 20.4 | 18.6 | 14.0 | 12.2 | 11.3 | 11.3 | 11.2 | 12.7 | 11.6 | 10.3 |
| NZD/JPY | 17.2 | 17.2 | 14.5 | 13.2 | 12.5 | 12.4 | 14.6 | 16.3 | 15.8 | 13.8 | 12.2 | 12.3 | 14.6 | 16.9 | 19.6 | 18.3 | 12.9 | 11.9 | 11.2 | 10.3 | 11.2 | 19.5 | 14.8 | 11.3 |
How This Table Is Computed
This is the same Dukascopy hourly bid candle cache behind the average daily range table, sliced a different way. Instead of aggregating each UTC day into one high-low figure, every hourly bar is kept on its own and grouped by its UTC hour of day, 0 through 23, across each pair’s most recent 250 qualifying sessions - the identical session window the daily table calls ADR250, so the two pages describe the same stretch of market rather than two different ones.
A day only contributes its hours if it passes the same filter the daily table uses: a weekday carrying at least 12 hourly bars and a non-zero high-low range for the day as a whole. That drops Saturdays, the Sunday-evening opening stub, and near-closed holidays before a single hourly figure is touched. Within a qualifying day, an individual hourly bar is only used if its own high is above its low - a flat or corrupted bar is dropped from that hour’s sample rather than counted as a zero. Nothing here is a forecast, and most retail traders lose money trading forex regardless of which hour they choose to place an order.
One number ties this page to the daily one directly: summing a pair’s qualifying sessions and averaging their daily high-low gives 62.5 pips for EUR/USD and 130.3 pips for GBP/JPY here - matching the ADR250 figures on the daily table to the decimal, because both scripts apply the same session filter to the same cached candles independently.
The London/New York Overlap Wins for Most Pairs
Sorted by widest hour, the table separates into a clear majority and three small exceptions. Twenty of the 28 pairs - all seven GBP pairs among them - post their single widest average hour at 14:00 UTC. Two pairs, EUR/USD and USD/JPY, peak one hour earlier at 13:00. EUR/JPY is the lone early outlier, widest at 07:00 UTC around the London open rather than the New York overlap.
Five pairs peak at 21:00 UTC instead: CAD/CHF, NZD/CHF, AUD/NZD, AUD/CHF, and NZD/CAD. We do not read that as a hidden fifth session. 21:00 UTC is 5 p.m. in New York while the US is on daylight time - the daily rollover, when liquidity thins and spreads typically widen - and because these are bid candles, a bid that drops as the spread opens registers as range even if the mid price barely moved. The seasonal split is consistent with that reading: AUD/NZD’s widest hour is 21:00 UTC at 28.0 pips in the April-September bars and 22:00 UTC at 16.3 pips in the October-March bars, moving with the New York clock. Treat the 21:00-22:00 figures on these crosses as a measure of rollover conditions, not of movement a strategy could trade.
The quietest hours mirror this from the other side: 23:00 UTC is the single most common quiet hour, holding that title for 11 of the 28 pairs, with 19:00 and 04:00 UTC picking up most of the rest. That window - roughly 19:00 to 04:00 UTC - sits after New York closes and before London opens, when only the smaller Sydney and Tokyo sessions are running.
EUR/USD vs GBP/JPY: Same Shape, Different Scale
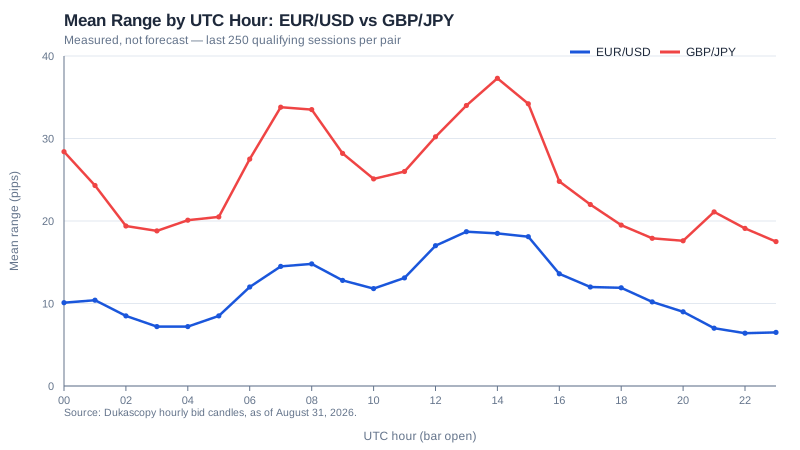
The two lines trace the same shape - low overnight, climbing through the London open, peaking in the New York overlap, falling back overnight - because both pairs answer to the same session calendar. What differs is scale: GBP/JPY’s quietest hour, 17.5 pips at 23:00 UTC, is nearly as wide as EUR/USD’s widest hour, 18.7 pips at 13:00 UTC. GBP/NZD’s 14:00 UTC hour, at 38.3 pips, is the single widest hour-and-pair combination measured anywhere in this table; EUR/GBP’s 03:00 and 04:00 UTC hours, at 3.0 pips each, are the quietest. A pip is not the same amount of account currency across pairs, so this chart reads as a distance comparison, not a money comparison - the pip value calculator converts a pip figure into your own account currency.
The Widest-to-Quietest Ratio, Pair by Pair
The ratio column in the summary table above is more informative than either hour alone, because it says how lopsided a pair’s day is rather than just how big its biggest hour gets. CAD/CHF has the widest ratio in the table at 3.45x: its 21:00 UTC hour runs more than three times its 03:00 UTC hour, even though neither hour is particularly wide in absolute pips - and that 21:00 figure is the rollover hour described above, so the ratio overstates how lopsided its tradeable day is. Among the pairs whose widest hour sits in the London/New York overlap, GBP/CAD is the most lopsided at 3.37x. NZD/JPY sits at the other end at 1.90x - still a real difference, but the flattest hour-to-hour shape of the 28. A pair with a high ratio concentrates its movement into a narrow part of the day; a pair with a low ratio spreads it more evenly across the full 24 hours.
What This Means for Grid Spacing and EA Behaviour
A grid EA’s spacing parameter is a bet on how far price moves before the next level should fill, and this table shows that bet is not uniform across the day even for a single pair. A EUR/USD grid spaced for its 18.7-pip 13:00 UTC hour is spaced roughly three times too wide for its 6.4-pip 22:00 UTC hour - the same fixed step that fills two or three levels during the New York overlap may not fill one during the overnight lull. That is a mechanical consequence of holding spacing constant while the hourly range it is measured against changes by the ratios in the table above, not a claim about which hours are better to trade; the grid trading strategy guide derives spacing from the daily ADR20 figure rather than an hourly one specifically because averaging across a full day smooths this swing out, and the grid spacing calculator applies that same formula to whatever reading you enter. An EA that restricts its trading hours - the approach dynamic grid trading discusses adjusting spacing for instead of switching off - is implicitly choosing a point on this hourly curve every time it sets a start and stop hour. A wider hour is not automatically a more tradeable one: spreads widen during the same session-open and session-close hours that also widen the range, so part of a bigger measured move is the cost of getting in and out, not room to profit from.
Daylight Saving and the Limits of a UTC Average
UTC hours never move, but the London and New York sessions they contain do: the UK and EU shift daylight saving on the last Sunday of March and October, the US on the second Sunday of March and first Sunday of November - different dates, as the forex trading sessions guide covers in full. A whole-window average like the one above sits across both halves of the year, so it smears each session’s true clock-time open across two adjacent UTC hours rather than showing either cleanly.
Splitting the same EUR/USD bars by calendar month shows the smear directly: in the northern-hemisphere summer months (April-September), EUR/USD’s widest hour is 14:00 UTC at 18.0 pips; in the winter months (October-March), it is 15:00 UTC at 21.9 pips. Neither figure is wrong - they describe the same underlying session at two different UTC offsets - but a full-year average sitting between them, as the main table does, is not quite either season’s true pattern. Treat the hour-level figures above as approximate to the neighbouring hour for this reason, while the wide-versus-quiet ranking between hours holds up in both halves of the year.
How This Differs From the Average Daily Range Table
The average daily range table answers “how far does this pair typically move in a day,” with one figure per pair across three session windows. This page answers a narrower question: within that day, when does the movement happen. They are built to agree rather than compete - the same session filter, the same 250-session window, the same cached candles - and the EUR/USD and GBP/JPY cross-check above confirms they do. Use the daily table for stop distance and position sizing, and this one for deciding which hours a strategy should be watching, filtering, or standing aside from.
Refresh Schedule
The data behind this table refreshes on the same monthly schedule as the daily ADR table, from the same Dukascopy cache, so both pages age and update together. A pair that fails to download is omitted here and named in the note under the table, the same policy the daily table follows - nothing is estimated or carried over from a previous run. Ready to see how a spacing rule holds up against real hourly swings rather than a single daily average? Open a free XM account and test it on a demo before sizing it against real capital.
Related Guides
- Forex Average Daily Range Table - the same pipeline’s one-figure-per-day view
- Forex Trading Sessions Explained - the Sydney/Tokyo/London/New York calendar this table’s hours sit on top of
- Grid Trading Strategy - the ADR20 spacing formula this hourly view helps explain
- Grid Spacing Calculator - applies that formula to your own ATR or ADR reading
- Dynamic Grid Trading - spacing that adapts to volatility instead of holding it fixed
- Performance - our EAs’ backtest results (hypothetical, with as-of dates) and the methodology behind them
This guide is for educational purposes only and is not investment advice. The figures above describe hours that have already happened; they do not indicate what any pair will do in its next session. Forex trading carries substantial risk and most retail traders lose money. Position sizes and trading hours should reflect your own risk tolerance and account size.