How to Backtest a Forex EA
Backtesting runs an Expert Advisor’s rules against historical data before you commit money. The framing that matters: a backtest is good at rejecting strategies and bad at confirming them. A failing backtest is near-conclusive; a passing one is a hypothesis.
This walkthrough runs one real backtest end to end, using MT4’s Strategy Tester, then reads the result the way we read our own. If you’re deciding which platform to test and trade on in the first place, MT5’s tester diverges meaningfully for multi-symbol and portfolio backtests — see MT4 vs MT5 for Expert Advisors for that comparison.
Step 1: Load the History and Set Up the Test
In MT4, Tools → History Center (F2), download 1 Minute (M1) for the symbol, then check the earliest bar you actually received: the tester builds every higher timeframe from M1, and if that history has holes it fills them silently and still prints a number. Then Ctrl+R:
| Setting | Value | Why |
|---|---|---|
| Model | Every tick | Open prices only cannot tell whether stop or target hit first |
| Symbol / period | The EA’s design timeframe | An H1 strategy on M5 is a different strategy |
| Spread | Your broker’s typical figure, fixed | Defaults are kinder than reality |
| Deposit | What you would really deposit | Sizing math differs at $200 and $10,000 |
Under Expert properties, use your live settings and set EnableAuth = false.
Match the Deposit to Your Actual Leverage Cap
The Deposit setting above is where an FCA-, CySEC-, or ASIC-regulated account most often gets backtested wrong. ESMA caps retail leverage on major FX pairs at 30:1 for EU accounts (Board of Supervisors decision, 23 March 2018, effective 1 August 2018, as published by ESMA), the FCA confirmed the same structure permanently for UK retail clients (Policy Statement PS19/18, published 1 July 2019, rules effective 1 August 2019, as published by the FCA), and ASIC applies the same 30:1 cap for Australian retail clients from 29 March 2021, as published by ASIC. If you backtest with a $200 deposit and the lot sizes an EA’s money-management logic selects at that balance, but you will actually trade the strategy through a tier-1-regulated entity at 30:1 rather than an offshore 1:500 account, the margin required per lot is over 16 times higher (500 ÷ 30 ≈ 16.7) — the position sizing the tester exercised may not be available to you at all at that deposit. Set the Deposit field to reflect the leverage your actual regulated account will run under, not a generic default, or Step 6 below (Live) will start from a sizing assumption the backtest never tested.
Step 2: Run the Test and Read the Header First
When it finishes, read three header fields before net profit: modelling quality (25.00% is open prices only; n/a means the data could not support the model), mismatched charts errors (above zero means the tester patched gaps), and bars in test (an H1 run over 26 months should be near 13,000). Fail those and the rest is decoration — go back to Step 1 rather than trusting a number built on bad header fields.
Step 3: Check the Report Against Six Ways a Backtest Lies
Before trusting the net-profit line, run the finished report against this checklist. Each failure mode makes the report look better, which is why they survive uncaught.
1. Look-ahead bias. The EA uses information that did not exist when it traded — the still-forming bar’s close, or an indicator read on bar zero not bar one. Symptom: a win rate above 80%, a near-straight equity curve, entries landing within a pip of bar extremes.
2. Survivorship in parameter selection. You tested twelve symbols and thirty parameter sets and kept the one that worked. Nothing in that report is false; the selection around it is. Symptom: a result set with no losing pairs, or per-pair parameters differing for no stated reason.
3. Omitted spread and commission. Costs left at zero, or a headline spread that only exists at midday London. Symptom: an average win under 10 pips alongside a spread setting under 5 points — the edge is smaller than the cost it never paid (spreads and commissions).
4. Modelling-quality traps. Open-prices-only modelling assumes price went straight from open to close, so a trade with stop and target both inside the bar’s range resolves in whatever order the tester guesses. Symptom: the header fields from Step 2, plus stops and targets close together relative to bar range.
5. Overfitting through optimisation passes. Every pass is another lookup into the same history; two thousand will find a set that fits the noise. Symptom: the chosen value sits on a lone spike in the optimisation surface, not a plateau, and moving one input a single step collapses it.
6. Regime dependence. The strategy earned everything in one market condition and merely survived the rest. Symptom: the curve’s slope concentrates into one three-to-six-month stretch, and the final third is flat or negative.
Step 4: Read a Real Result — Our Own
Here is what applying that checklist looks like against an actual report, not a hypothetical one. All figures below are corrected results from our performance page: 2024-01 → 2026-03, H1, hypothetical.

SnapBack on EURUSD: 79 trades, profit factor 1.65, win rate 62.0%.
Start with arithmetic the table does not show. 62.0% of 79 is 49 winners and 30 losers, so 1.65 = (49 × average win) / (30 × average loss) puts the average winner at about 1.01× the average loser — a near-coin-flip payoff carried by hit rate, with expectancy 0.62 × 1.01 − 0.38 × 1.00 ≈ 0.25 risk units per trade.
Now stress it, the way Step 3’s checklist asks you to. Turn six of those 49 winners into losers — 43 wins, 36 losses at the same payoff — and profit factor falls to (43 × 1.01) / 36 ≈ 1.21, below our 1.3 gate. Six trades out of 79 separate a pass from a fail. The interval agrees: the standard error of a 62% rate over 79 trades is sqrt(0.62 × 0.38 / 79) ≈ 5.5 points, so the true rate plausibly sits near 51%–73%, where profit factor is about 1.05 — break-even.

QuickPulse on EURUSD: 521 trades, profit factor 0.93, win rate 17.5%. This chart is the instructive one because it ends underwater, which tells you what a rising curve cannot: the cost structure, not bad luck, is the problem. At a 17.5% win rate the payoff ratio needed merely to break even is (1 − 0.175) / 0.175 ≈ 4.71. The test delivered 0.93 × (430 / 91) ≈ 4.40 — about 7% short, across 521 trades. At that sample size it is a design result, not noise.
The failing rows are the valuable ones. QuickPulse failing on all three pairs, and SnapBack failing on USDJPY at 0.58, are the entries you can trust most, because nobody selects for them. On a vendor’s EA page, the absence of any failing row is itself the finding (how to choose an EA).
A Lesson From Our Own Bug: July 30, 2026
Every figure above is a replacement. Our engine decodes Dukascopy hourly bar files directly and was reading each bar’s two extreme prices in the wrong order — high and low inverted, on every bar — corrupting stop and target touch detection, ATR, and the ADX components. We re-ran every published test on corrected data with no parameter changes; the numbers came back worse and QuickPulse’s recommendation was withdrawn (correction note, July 30 2026).
The lesson transfers to your own Step 1: if you decode price files yourself rather than relying on the platform’s own history, assert low <= open <= high and low <= close <= high on every bar before it reaches the tester. A silent decoder bug produces a report that looks exactly like a real one.
Step 5: Split In-Sample From Out-of-Sample
Our test window above is 26 months. A 70/30 split applied to it looks like this:
| Segment | Period | Length | Use |
|---|---|---|---|
| In-sample | 2024-01 → 2025-06 | ~18 months | Choose strategy and parameters; look as often as you like |
| Out-of-sample | 2025-07 → 2026-03 | ~8 months | Run once, at the end, parameters frozen |
A pass is an out-of-sample profit factor inside the interval implied by the in-sample trade count, with trade frequency and payoff shape unchanged. A fail is a profitable in-sample result and a flat or negative tail — or one where the win rate holds but the payoff ratio collapses, meaning fitted exit logic.
Our own tests hit a hard limit here. SnapBack EURUSD took 79 trades in 26 months, so an 8-month tail holds about 24 trades — far too few to separate a working strategy from a broken one. Our performance page calls 26 months short; this is the sharper version of that admission.
One rule voids the exercise: adjust a parameter after seeing the out-of-sample result and that data has joined your in-sample set. You get one look.
How Many Trades a Result Needs Before It Means Anything
Assumptions: a 55% win rate, average win equal to average loss, independent trades. Real sequences are not independent — an EA opening several positions inside one move is taking one bet — so these are the optimistic case.
| Trades | 95% interval on win rate | Implied profit factor | What it supports |
|---|---|---|---|
| 30 | 36.8% – 73.2% | 0.58 – 2.73 | Nothing; spans losing to excellent |
| 50 | 40.9% – 69.1% | 0.69 – 2.23 | A sanity check on mechanics |
| 100 | 45.0% – 65.0% | 0.82 – 1.86 | A floor for looking, not a sufficiency test |
| 250 | 48.7% – 61.3% | 0.95 – 1.58 | The sign of the edge is arguable |
| 500 | 50.5% – 59.5% | 1.02 – 1.47 | 1.3 separates from 1.0 |
| 1,000 | 51.9% – 58.1% | 1.08 – 1.39 | Direction, not magnitude |
Step 6: Decide Go / No-Go Into Demo, Then Live
Backtest gate. Go only if all five hold:
| Criterion | Threshold |
|---|---|
| Modelling quality | ≥ 90%, mismatched chart errors = 0 |
| Trades | ≥ 100 in the window |
| Profit factor | > 1.3 (our gate — set your own, then keep it) |
| Concentration | No single trade above 10% of gross profit |
| Distribution | Every calendar year in the window non-negative |
Fail one and the answer is no; re-optimising to pass is failure mode 5 from Step 3.
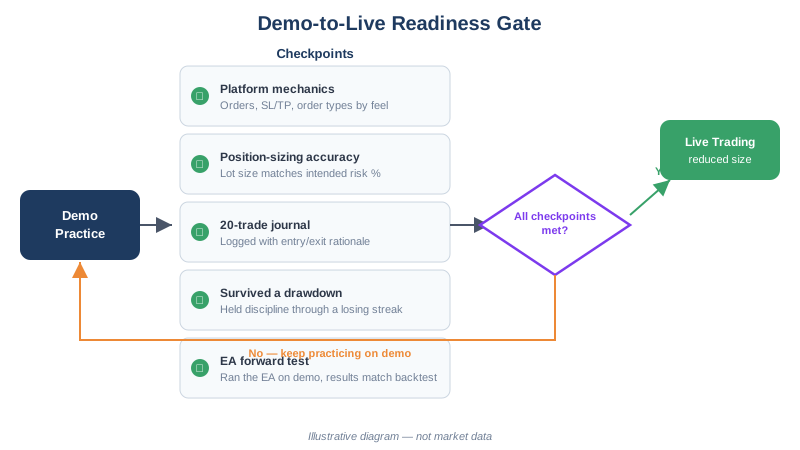
Demo forward test. Minimum 30 days and 20 trades, whichever takes longer, at your intended broker on a demo account. Go if the observed win rate falls inside the backtest’s interval, slippage per trade is recorded and small next to the average win, and every trade is one the backtest logic would have taken. Stop if the EA takes trades you cannot account for — a configuration mismatch will not fix itself.
Live. Start at 25% of intended size for 30 trades. Return to demo if live drawdown exceeds 1.5× the backtest maximum at the same risk setting, or those 30 trades land outside the implied interval. Size up after the review, never during a winning run.
Our seven EAs — including BreakWave, a Bollinger squeeze breakout system — are free in MT4 and MT5 builds if you want something to test this walkthrough against — download them. If you’re wondering whether BreakWave EA is AI-powered or rule-based, the product page lists exactly which indicators drive each entry.
Go Deeper
- What Is an Expert Advisor? — what you’re backtesting and why
- How to Choose a Forex EA in 2026 — reading a vendor’s backtest claims critically
- Demo Account Guide — the forward-test stage after a passing backtest
- Forex Risk Management Guide — the position sizing a backtest assumes
Backtesting limitations: past performance is not indicative of future results. Backtests cannot fully account for slippage, spread variation, requotes, or conditions absent from the window. All figures referenced here are hypothetical backtested results. Forward-test on demo before going live, and read our risk disclosure.